Skip main navigation

New offer! Get 30% off one whole year of Unlimited learning. Subscribe for just £249.99 £174.99. T&Cs apply

The multivariate normal distribution

In this article, Marcel Lüthi summarises the main properties of the multivariate normal distribution, which are important in shape modelling.

The main assumption underlying the shape models we study in this course is that the shape variations can be modelled using a normal distribution. In this article, we summarise the main properties of normal distributions and show how they manifest themselves in shape modelling. In case you are not familiar with the concepts described here, we highly recommend that you spend some time studying them, as this course relies heavily on these concepts (you find some pointers to literature in the Glossary).

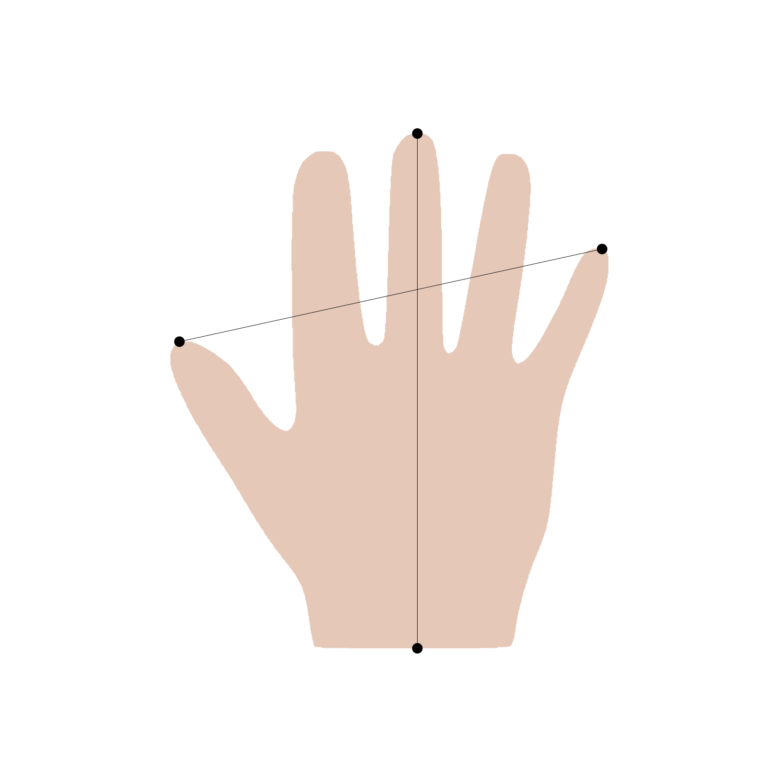
Measurements for the length and the span of a hand shape.Figure 1: measurements for the length and the span of a hand shape.

The running example in this article is a simple model of a hand shape which is described by only two parameters: the length and the span (see Figure 1). We start by modelling the length. Our main assumption is that the length follows a univariate normal distribution.

The univariate normal distribution

The normal distribution is completely defined by two parameters: the mean (mu) and variance (sigma^2). Its probability density function is given by

p(x)=frac1sigmasqrt2piefrac(xmu)22sigma2.

Density function of the univariate normal distributionFigure 2: the density function of the univariate normal distribution with (mu=0) and (sigma^2=0.25) (left), (sigma^2=1) (centre) (sigma^2=2) (right).

The normal distribution is symmetric around the mean and it assigns a non-zero probability everywhere (cf. Figure 2). The variance (sigma^2) determines how far the values are spread around the mean. The further away a value lies from the mean the less likely it becomes. The probability of observing a value that is outside of an interval of (3sigma) is less than (0.01).

The normal model captures our assumption about the length of a hand rather well. There is an average around which most values are distributed. The possibility of observing unusually long or short hands remains, but the more the observed length deviates from the mean, the less likely we are to ever see such a hand.

To define the model, we need to choose values for the parameters (mu) and (sigma^2). A reasonable approach is to take a ruler and measure the hand of a number of people. We obtain a set of values ({l_1, ldots, l_m}), which we can use to estimate these parameters using the well-known formulas for the sample mean and sample variance:

hatmu=frac1msumi=1mli
and
hatsigma2=frac1m1sumi=1m(lihatmu)2.

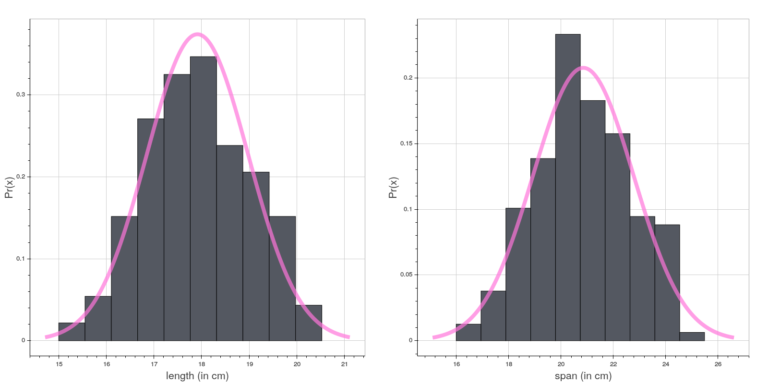
Histogram for the span and length obtained from 169 measurements.Figure 3: histogram for the span and length obtained from 169 measurements.

Figure 3 shows a histogram obtained from 169 hand measurements and the normal distribution estimated from the data. We see that the normal assumption is indeed reasonable for length and span.

The bivariate normal distribution

We can obtain a more interesting shape model by modelling the span (s) and length (l) jointly. We assume that it follows a bivariate normal distribution:

Misplaced &

To define the distribution, we specify the mean and variance for the span (mu_s) and (sigma_{ss}) and the length (mu_l) and (sigma_{ll}) as well as the covariance (sigma_{ls} = sigma_{sl}). The covariance describes the coupling between the variables. If (sigma_{ls} = 0), it means the two variables are independent, otherwise we know that the values are correlated. In our case, it is intuitively clear that the span and the length of the hand are correlated, as both are related to the size of the hand.

The marginal and conditional distributions

Two distributions that can be derived from the bivariate normal distribution will play a very important role in this course. The first is the marginal distribution, which gives us the distribution for (s) (or (l)) separately. The marginal distribution for (s) is the distribution we obtain if we do not know anything about the value of (l). It is simply the univariate normal defined if we drop all variables that are not related to (s), i.e. (s sim N(mu_s, sigma_s)). The second important distribution is the conditional distribution (s |l). It can be shown that also this conditional distribution is a univariate normal distribution. It models the span (s) given that we know the length (l). As we assumed that span and length are correlated, the variance in the conditional distribution should be smaller than in the marginal distribution, where we do not assume anything about the length.

The multivariate normal distribution

Normal models can be defined for any finite number of variables using the multivariate normal distribution (N(mu, Sigma)). It is specified by a mean vector (mu in mathbb{R}^n) and a covariance matrix (Sigma in mathbb{R}^{ntimes n}):

Misplaced &

The diagonal entry (Sigma_{ii}) defines the variance of the variable (x_i), whereas the entry (Sigma_{ij}, i neq j) defines the covariance between (x_i) and (x_j). A valid covariance matrix is required to be symmetric and positive semi-definite. The marginal and conditional distributions can be defined also in this more general case. They are both multivariate normal distributions themselves whose parameters can be computed efficiently using closed-form formulas. We will discuss the exact formulas later in this course.

© University of Basel
This article is from the free online

Statistical Shape Modelling: Computing the Human Anatomy
Created by
FutureLearn - Learning For Life

Reach your personal and professional goals

Unlock access to hundreds of expert online courses and degrees from top universities and educators to gain accredited qualifications and professional CV-building certificates.

Join over 18 million learners to launch, switch or build upon your career, all at your own pace, across a wide range of topic areas.

Start Learning now