
Annotating Time Series Data
So far we have learned about the process of date locator and formatters and have also tried plotting time series data on Matplotlib. Let’s see how to annotate the data we plot on time series.
Annotation makes storytelling clear and interesting. It adds value to the data and helps to classify the different variables and groups effectively. Sometimes we want to draw attention to certain parts of a plot. We can do this by annotating through adding notes, comments, and an explanation to the graph.
Example: In the graph shown below, the different colour lines are labeled at the top of the graph to point to the highlights of the graph.

Annotation in Matplotlib
Matplotlib has a variety of different annotations that can be added to plots, from simple text labels to arrows to point out features. The basic method of adding annotations is to tell Matplotlib:
- what annotation you want to add
- where it should be placed (coordinates).
We’ll look at the Axes.annotate method of placing annotations. This is a helper wrapper method around some lower level functions.
Coordinate Systems
Matplotlib provides different coordinate systems to add annotations to the chart. You can position annotations based on (among other things):
-
-
the coordinate system of the data
-
the coordinate system of the data
-
-
the coordinate system of the pixels of the axes.
-
the coordinate system of the pixels of the axes.
Follow the instructions below, along with the codes in your Jupyter Notebook.
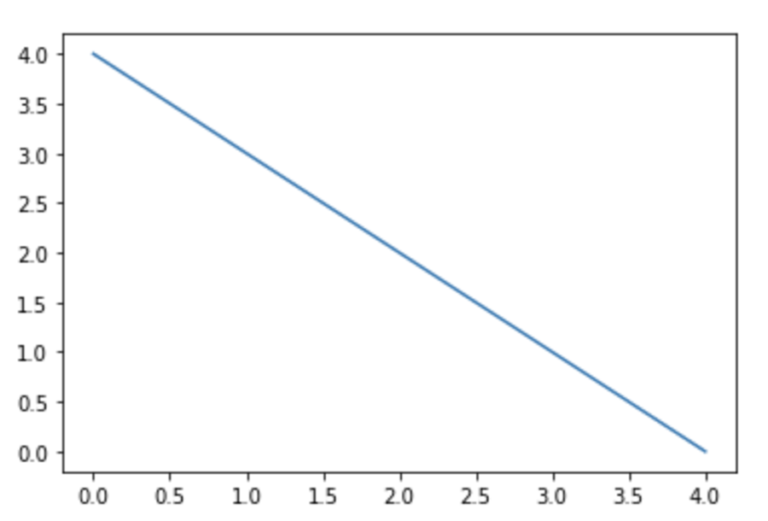
Step 1
Plot simple line: Let us first plot a simple line.
Code:
fig, ax = plt.subplots()
ax.plot([4, 3, 2, 1, 0])
Output:
Step 2
Set the annotation origin: Since the range of this chart spans from data points (0, 0) to (4, 4), the data point (2, 2) is in the centre (the positioning of annotation is based on the x- and y-values of the axes.) Now, add a text annotation at point (2, 2).
Code:
ax.annotate("Data 2, 2", xy=(2,2))
Output:
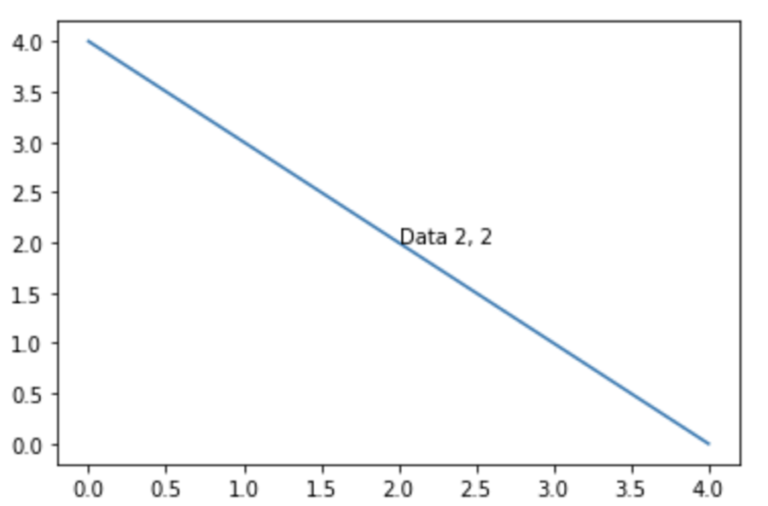
You can see the annotations origin (bottom-left corner) is at the centre.
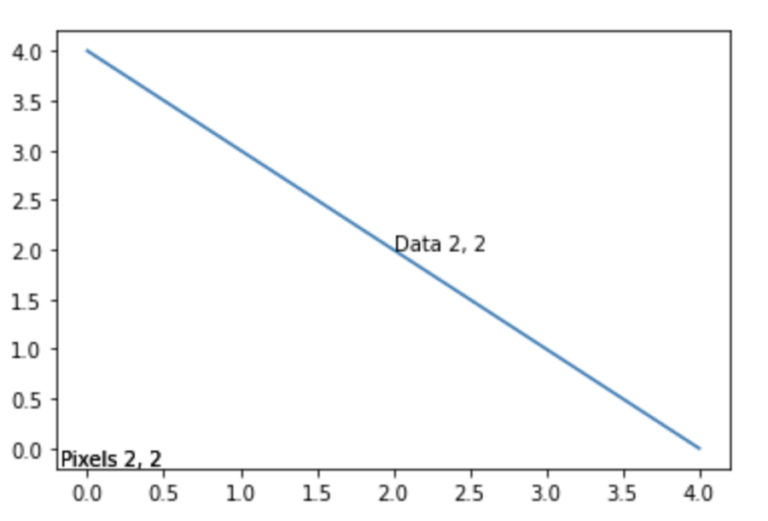
Step 3
Use the ‘axes pixels’ coordinate system. Compare the output by drawing an annotation at (2, 2), using the ‘axes pixels’ coordinate system, which treats the x- and y-position as points from the lower left of the axes, in pixels. The coordinate system is set with the xycoords keyword argument.
Code:
ax.annotate("Pixels 2, 2", xy=(2,2), xycoords="axes pixels")
Output annotation: at pixel position (2, 2).
Step 4
Fixing the text alignment: You’ve probably noticed that although we drew the text in the centre of the diagram, it isn’t actually in the centre. Instead, its origin is in the centre and the text extends up and right from there.
This can be fixed by passing the horizontalalignment (left, right, or centre) and verticalalignment (centre, top, bottom, baseline, or centre_baseline) keyword arguments to the annotate method. We can ‘correct’ the positioning of the centre annotation by providing ‘centre’ as both of these arguments.
Code:
data_ann.remove()
pixel_ann.remove()

centered_ann = ax.annotate("Centered Data 2, 2",
 xy=(2,2), horizontalalignment="center",
 verticalalignment="center"
 )
Output:
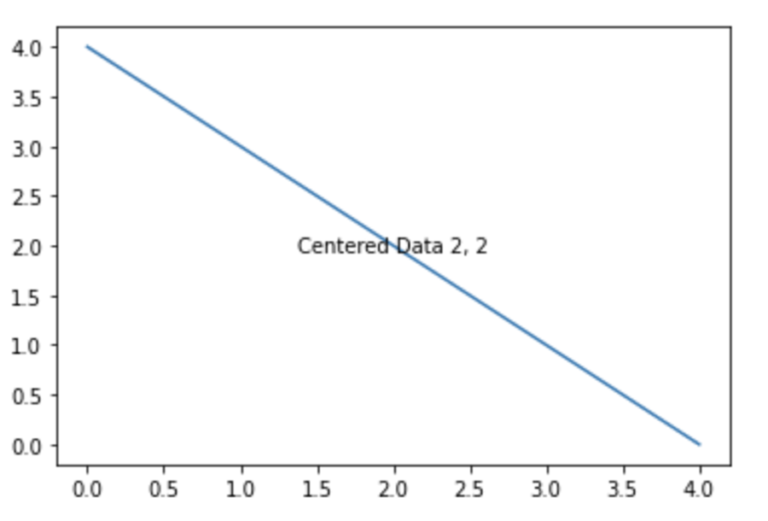
The new annotation is now centered.
Step 5
Add arrows to your plot: Add arrows to your plot to point out specific features. To add an arrow, the keyword argument arrowprops must be passed to the annotate method, which is a dictionary that contains properties used to define how the arrow is displayed. At a minimum, you will probably use these properties:
-
-
facecolor: The colour of the arrow.
-
-
-
shrink: The percentage to ‘pull’ the arrow in from the text and where it points. (A good value is 0.05, or 5%.)
-
-
-
Provide separate positions for the point of the arrow and the text position (the arrow will be drawn between these two points).
-
Provide separate positions for the point of the arrow and the text position (the arrow will be drawn between these two points).
-
-
The data point (and tip of the arrow) is positioned with the
xykeyword argument, while the text is positioned with thexytextkeyword argument.
-
The data point (and tip of the arrow) is positioned with the
-
-
We can set the coordinate system of the data point and text with the keyword arguments
xycoordsandtextcoords, respectively. The coordinate system is ‘data’ by default.
-
We can set the coordinate system of the data point and text with the keyword arguments
-
-
Putting this all together, we can add an arrow annotation by calling the
annotatemethod like this:
-
Putting this all together, we can add an arrow annotation by calling the
Code:
centered_ann.remove()

ax.annotate("Look at point 1, 3", xy=(1, 3),
 xytext=(1, 1.5),
 arrowprops={"facecolor": "black", "shrink": 0.05},
 horizontalalignment="center", verticalalignment="top")
Output:
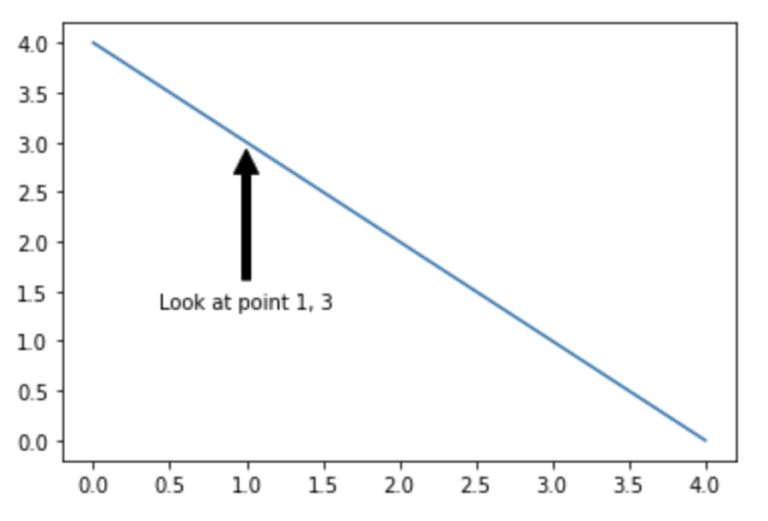
Now, as you see, an arrow has been added to the plot.
But how do we know where to put them, after all? You’ll learn more about this in the next step.
Reflect and Share
What kind of annotations have you been using in your work lately? Do they make any difference to the way you represent your data?
Data Visualisation with Python: Matplotlib and Visual Analysis


Data Visualisation with Python: Matplotlib and Visual Analysis
Reach your personal and professional goals
Unlock access to hundreds of expert online courses and degrees from top universities and educators to gain accredited qualifications and professional CV-building certificates.
Join over 18 million learners to launch, switch or build upon your career, all at your own pace, across a wide range of topic areas.